Here’s the first thing I hear when I tell someone how much protein I eat: That’s bad for your kidneys.
Are all these people doctors? Nephrologists? Psychics, perhaps, who are in touch with my kidneys through the other side?
Nope, but somehow the average person just knows that eating, say, 35% of one’s calories from protein will be bad for the kidneys. Have a few too many chicken breasts and you’ll end up on dialysis or feeling like you’ve slept with a cinder block under your lumbar spine.
Ask these folks what protein actually does to kidneys and you get a lot of vagueness. It’s just bad.
Meanwhile, the cola-chugging, fry-chomping, immovable object known as my office mate is left unquestioned about their lifestyle choices.
Kidney function
But is it actually true that protein will harm my kidneys?
Before I review this concept, let’s talk about what kidneys do, as well as a few measures your doctor uses to see whether your kidneys are happy and functioning.
Kidneys do several things. They:
- filter your blood, getting rid of waste
- regulate how much water and various salts you have in your blood
- help maintain proper blood pH (how acidic or alkaline your blood is)
- make hormones like erythropoietin (among others)
The argument about protein hurting kidneys — if anyone can actually substantiate it — comes from the theoretically increased load of having to process protein. The idea is that more protein equals more of a filtration challenge for the kidneys, which then triggers the inevitable kidney explosion or renal labour strike.
Measuring kidney function
There are about half a dozen measures used for kidney function but they all measure how much fluid (blood plasma) your kidney filters at any given time.
Glomerular filtration rate (GFR)
- This rate of filtering is called the glomerular filtration rate (GFR). GFR refers to filtration at a specific part of the kidneys where blood plasma is filtered, called the glomerulus.
- GFR isn’t that easy to measure, because you need to be injected with a substance that filters straight through the glomerulus without any trouble. Usually, a substance called inulin is used (not be confused with insulin).
- GFR is then calculated by taking samples of blood and samples of urine. GFR is determined by how fast inulin leaves the blood and ends up in the urine.
- Normal GFR is about 90-120 mL/min. Below 15 mL/min is kidney failure.
Creatinine clearance
- Creatinine is a normal byproduct of physical activity because of the breakdown of creatine phosphate found in muscle. More muscle mass means that more creatinine ends up in the blood.
- Creatinine clearance (filtration) is an indirect way of measuring GFR. Since creatinine is constantly being made by the body at a pretty constant rate, with only a little bit being reabsorbed, the rate that creatinine shows up in your urine is the rate your kidneys can filter.
- Normal values are 97-138 mL/min for men and 88-128 mL/min for women.
Indirect methods of figuring out kidney function: Urine albumin, BUN and plasma creatinine
- Instead of trying to calculate filtration rate, you can also look at increases in plasma levels of stuff your kidneys are supposed to be getting rid of, like creatinine and urea.
- Higher levels of plasma creatinine or blood urea (Blood Urea Nitrogen; BUN) likely mean your kidneys aren’t filtering efficiently enough to get rid of the excess.
- Normal creatinine levels are 0.5 to 1.0 mg/dL (about 45-90 μmol/L) for women and 0.7 to 1.2 mg/dL (60-110 μmol/L) for men. More muscle mass will increase those numbers. Normal BUN values are 10-20 mg/dL.
- Urine albumin tests how much of a protein called albumin is in your urine. There should be none. If there is some, it suggests that there is some damage that’s allowing albumin to pass through the kidneys.
- Under 20 µg of albumin per minute is considered normal kidney function.
Thus, we can use these types of measures to see whether the kidneys are, in fact, working properly. This week’s study uses kidney tests along with other tests to determine the safety and usefulness of a high-protein diet in a population who is already at higher risk for kidney damage.
Testing high protein and kidney function
So now that we know how to assess kidney function and potential damage, we can use these tests to figure out whether high-protein diets do, in fact, harm the kidneys.
To figure this out, we could test kidney function and high-protein diets in healthy people. Or we could go one step further and test high-protein diet on people whose kidney functions are already compromised: obese diabetics.
Obesity, diabetes and kidney disease
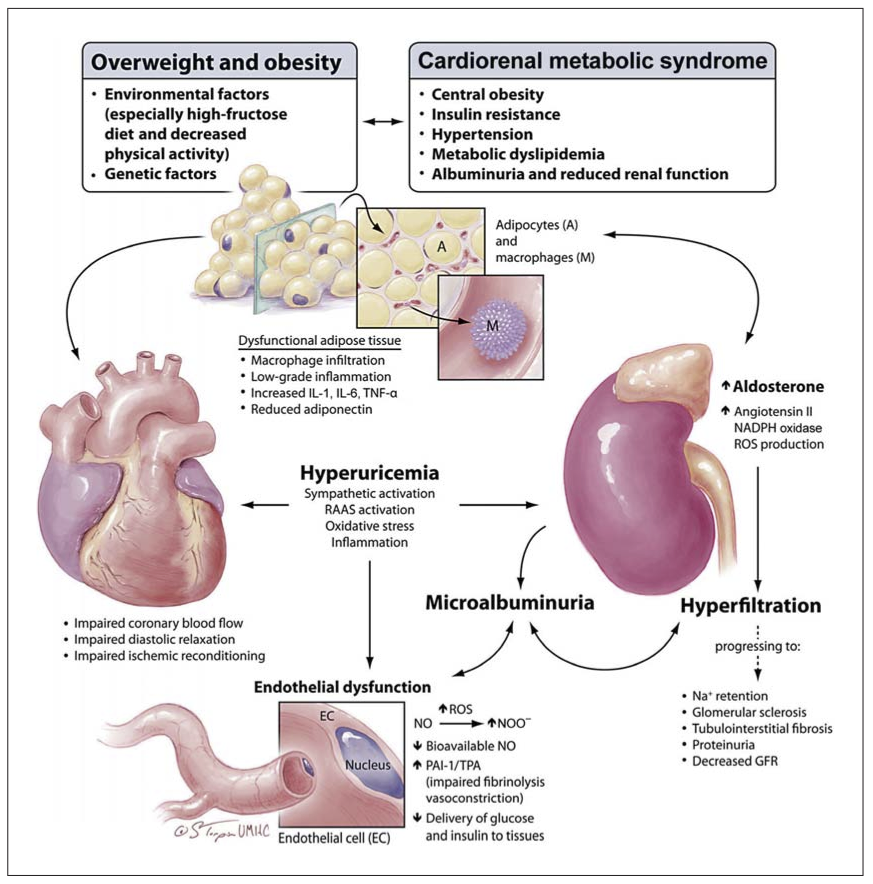
Obesity and type 2 diabetes can cause and exacerbate poor kidney function (1). One large-scale study found, for instance, that end-stage renal disease (ESRD) increased proportionately to body mass index (BMI): as BMI went up, so did kidney disease.(2)

Research question
This week’s study examines a high-protein diet and resistance training for people in a high-risk group: those that are overweight or obese and have type 2 diabetes. Contrary to popular expectations, their kidneys didn’t explode.
Wycherley TP, Noakes M, Clifton PM, Cleanthous X, Keogh JB, Brinkworth GD. A high-protein diet with resistance exercise training improves weight loss and body composition in overweight and obese patients with type 2 diabetes. Diabetes Care. 2010 May;33(5):969-76. Epub 2010 Feb 11.
Methods
Participants were men and women with an average:
- BMI of 35.4kg/m2 (roughly 39% body fat)
- age of 55 years
- weight of 103 kg (40 kg fat + 63 kg lean body mass)
In this study there were four groups:
- Control (CON) group members were placed on a hypocaloric diet (53% carbs, 19% protein and 26% fat)
- High-protein (HP) group members were on a hypocaloric diet high in protein (43% carbs, 33% protein and 22% fat)
- Control + resistance training (CON+RT) group members were on a hypocaloric diet and worked out with weights 3 days per week
- High-protein + resistance training (HP + RT) group members were on the same hypercaloric high-protein diet as group #2, but also doing the resistance training of group #3.
The study lasted 16 weeks. Body weight, body fat, blood pressure, strength and blood tests were recorded before and after.
Diet
Definitions of “high protein” vary in the literature. For bodybuilders and strength trainers, 2.2-4.4g of protein per kilogram of weight per day (1-2g/lb/day) is common.
Here, high protein was defined as 33% of total calories, or about 1.2g/kg/day (0.55g/lb/day). This group consumed about 2.04 g of protein per kg of lean body mass (or 0.92 g/lb lean body mass).
While this amount may be higher than conventional food guides would suggest, based on what bodybuilders and strength athletes normally consume, I wouldn’t call this truly a high protein diet.
Training
Groups 3 and 4 trained with resistance 3 times a week, with at least one day’s rest between workout days.
Each workout involved eight exercises with 70-85% of their 1 repetition maximum for 8-12 repetitions for 2 sets, with 1-2 minutes rest between sets. Weight was increased if they could do more than 12 reps for both sets.
Exercises were:
- leg press
- knee extension
- chest press
- shoulder press
- lat pulldown
- seated row
- triceps press
- sit-ups
All exercises but sit ups were done on machines.
All in all, not a particularly impressive workout program, but going from nothing to something is going to improve strength and muscle mass regardless.
Results
High protein + resistance training = fat loss
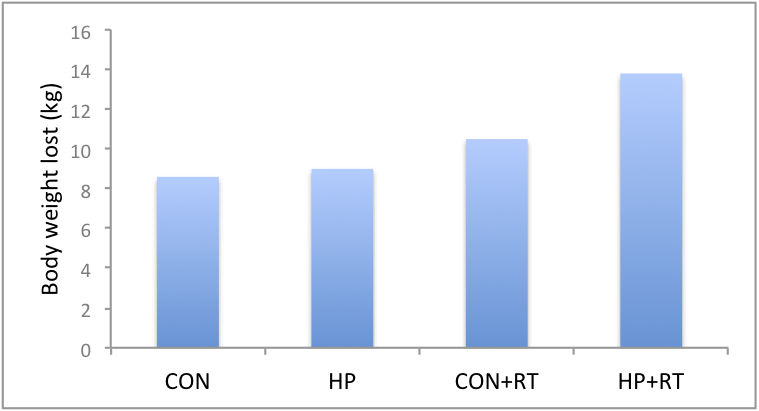
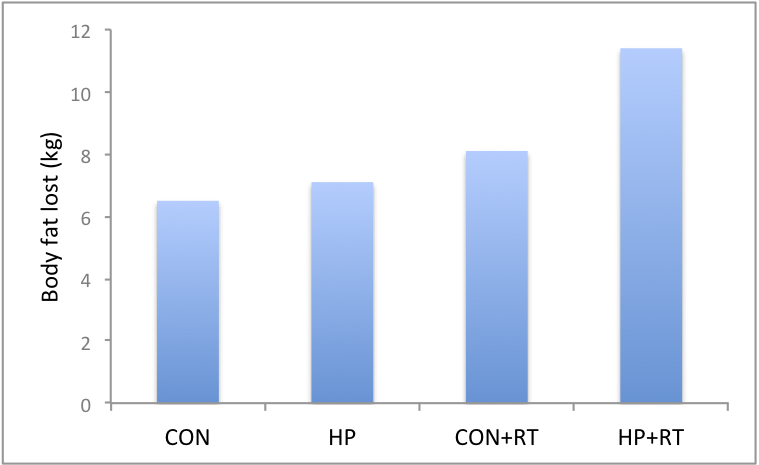
All groups lost weight (see Figure 1 & 2).
However, the HP+RT lost the most body weight and fat (13.8 kg and 11.4 kg, respectively).
The HP+RT group also lost more fat around their waist: 11.4 cm around their waist gone, compared the other groups that lost 8.2cm (CON), 8.9cm (HP) and 11.3cm (CON+RT).
High protein + resistance training = stronger
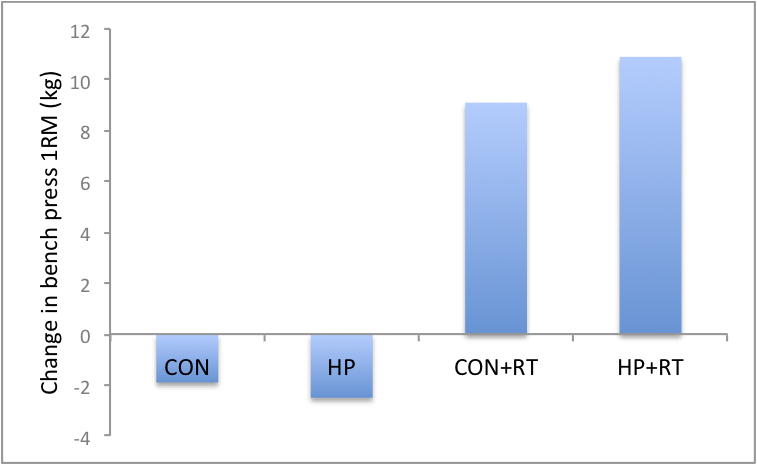
Both groups that worked out (CON+RT & HP+RT) got stronger while the other groups (CON & HP) got weaker when you look at their 1 RM on bench press (Figure 3).
Blood measures
All groups had improvements in their blood pressure after the 16 weeks (15 mmHg decrease in systolic blood pressure & 8 mm Hg decrease in diastolic blood pressure).
All groups had significant improvements in:
- plasma glucose (1.9 to 2.7 mmol/l)
- serum insulin (3.5 to 7.9 mU/l)
- triglycerides (0.3 to 0.6 mmol/l)
- total cholesterol (0.6 to 0.8 mmol/l)
- LDL cholesterol (0.2 to 0.5 mmol/l)
There were no differences between groups as far as blood measures go, though the authors suggest that having more people (increased statistical power) in the study would have helped show some blood differences. They argued more people in the study may show more blood measure improvements in the HP+RT group since they had marginal blood improvements across the board. But until they do a study with more people we can say for sure this is just speculation.
The HDL cholesterol was a little strange: it went down a little bit (0.1 mmol/l) over the 16 weeks in all the groups except the CON.
Legend
- CON – hypocaloric diet (19% protein)
- HP – hypocaloric high protein diet
- CON+RT – CON diet with weight training
- HP+RT – HP diet with weight training


High protein = no kidney problems
Here’s some data to help you stave off the Protein is going to make your kidneys explode crowd.
Since diabetes is the biggest cause of kidney failure and obesity is a contributing risk factor, you’d think that these overweight and obese diabetics eating high protein diets would have signs of kidney dysfunction. Nope.
Using creatinine clearance and urinary albumin to measure kidney function, the researchers found that there was no difference in these measures between the high protein diet and the control diet. Over time there was a decrease in creatinine clearance, but an improvement in microalbuminuria.
Conclusion
Overweight and obese diabetics (type 2) who eat a high protein (33%) but calorically restricted diet while weight training lost more overall weight and fat, and reduced their waist girth more, compared to those who were on a calorie-restricted diet with 19% protein.
There were no differences in blood lipids or other blood measures between groups (though with more participants, high-protein would have fared better), though there was an improvement over the 16 weeks of the experiment.
Despite concerns that high protein diet would comprise kidney function (especially in diabetics who are at high risk for kidney failure) there were no differences between groups and kidney function measures.
Bottom line
Weight training in combination with a high protein diet (33% of calories) is more effective for fat loss than just a high protein diet, or weight training with a diet lower in protein (19%).
Obese and overweight diabetics on a high protein diet or a control diet for 16 weeks had the same kidney function. Added protein had no negative effects, even in these folks who were at higher risk.
Enjoy your protein shakes, everyone.
References
Click here to view the information sources referenced in this article.
Eat, move, and live… better.©
The health and fitness world can sometimes be a confusing place. But it doesn’t have to be.
Let us help you make sense of it all with this free special report.
In it you’ll learn the best eating, exercise, and lifestyle strategies — unique and personal — for you.


Share